Google Analytics 4 (GA4) has become the standard for tracking and understanding user behavior online. But installing it correctly and knowing your way around the reports interface can be the difference between having data that helps you make informed decisions and having a confusing mess of numbers. In this guide, based on Analytics Mania’s insights, we’ll walk through installing Google Analytics, using Google Tag Manager (GTM), and making sense of its key reporting features.
At Cloud Sultans, our mission is to help small and large businesses to better collaborate and achieve high productivity with their teams by maximizing the power of Google Workspace (formerly GSuite).
1. Keep an Eye on the Change History
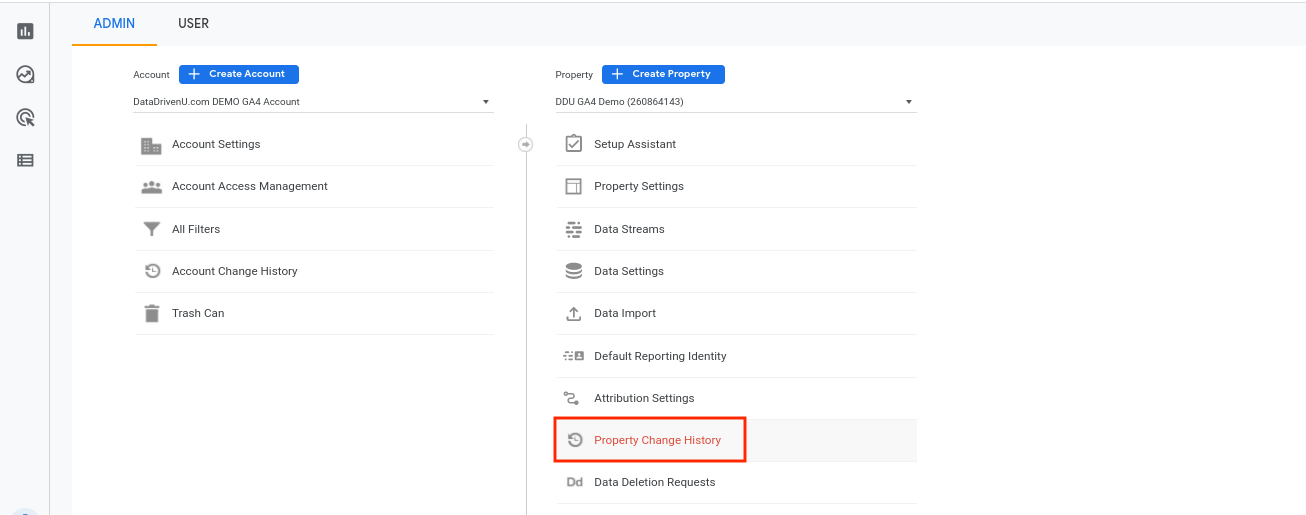
Before diving into setup, it’s wise to familiarize yourself with Google Analytics’s history feature. If your tracking suddenly stops working, history can reveal if someone altered or removed a Google Tag that broke your setup. By checking this section regularly, you can quickly diagnose changes and keep your data flow uninterrupted.
2. Setting Up Your Data Stream
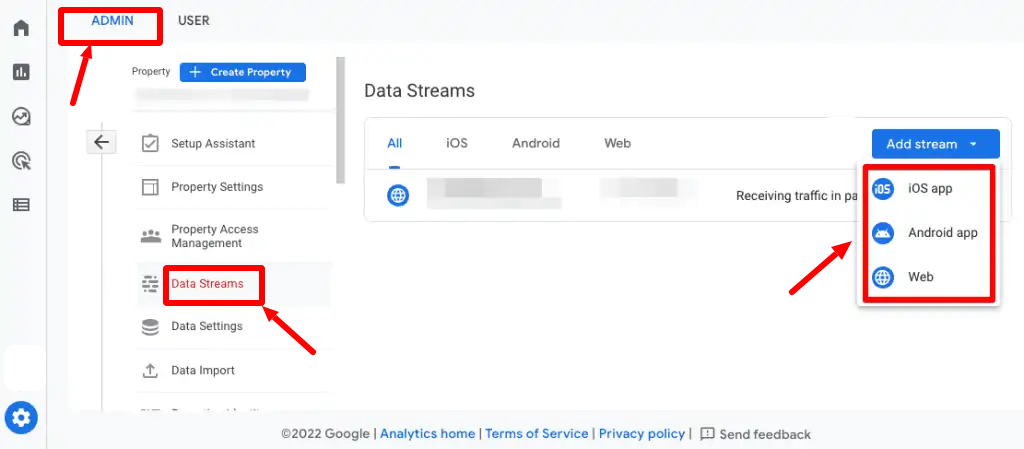
The foundation of Google Analytics tracking starts in the Admin → Data Streams section. Click on your website data stream to access the measurement ID — the key piece of information Google Analytics needs to track your site. If you’re using a content management system (CMS) like WordPress or Shopify, you can often paste this ID directly into its analytics integration. That’s usually enough to get data flowing.
3. Installing Google Analytics Manually (For Custom Websites)
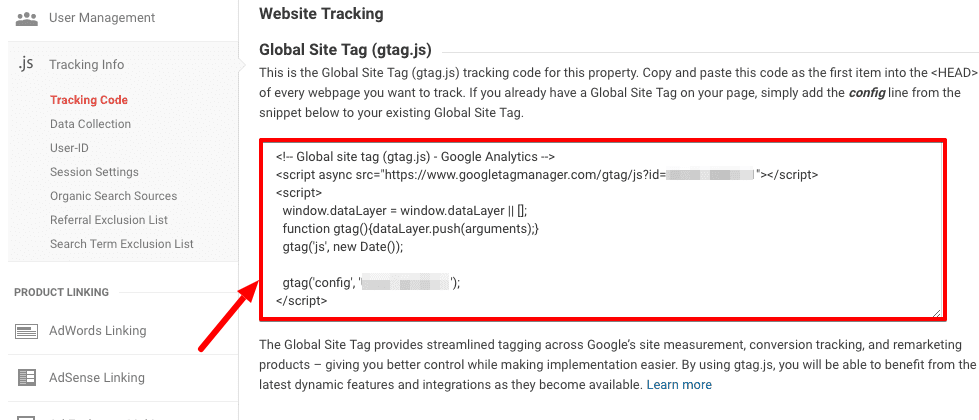
If your site is custom-built without CMS integrations or Google Tag Manager, you’ll need to install Google Analytics manually. This involves copying the provided GA4 tag code and pasting it into the <head> section of every page on your site. Developers often handle this step, ensuring the tracking code loads consistently so every visitor interaction is captured.
4. Why Use Google Tag Manager (GTM) for Google Analytics Installation
While manual installation works, Google Tag Manager offers far greater flexibility. GTM allows you to manage all your tracking codes in one place, deploy changes without altering your site’s code directly, and test before publishing. For long-term scalability, it’s the recommended method for Google Analytics installation.
5. Creating a GTM Account and Container
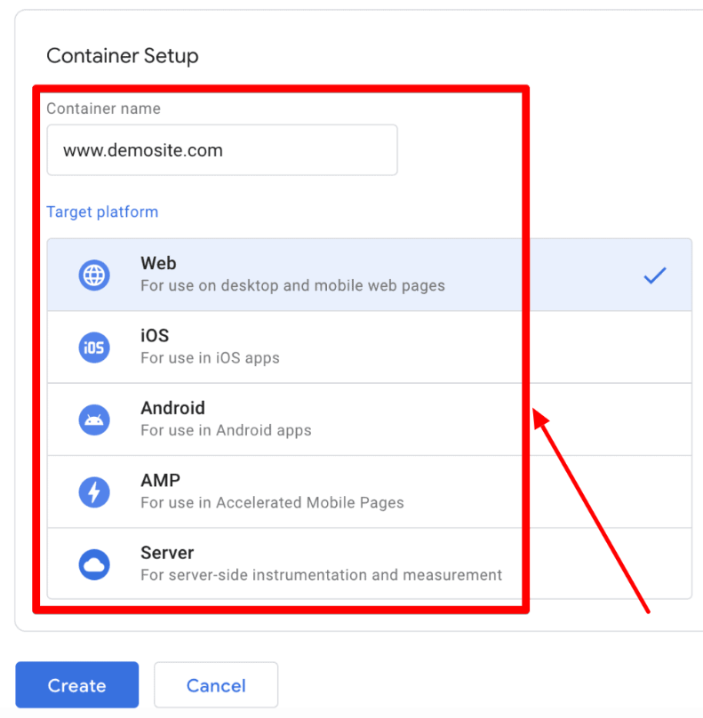
To start, head to tagmanager.google.com, create an account, and set up a container (choose “Web” as the target platform). You’ll receive a snippet of GTM code to paste into your website’s <head>. This container is where you’ll store all your tracking tags, including Google Analytics, making it your central tracking control hub.
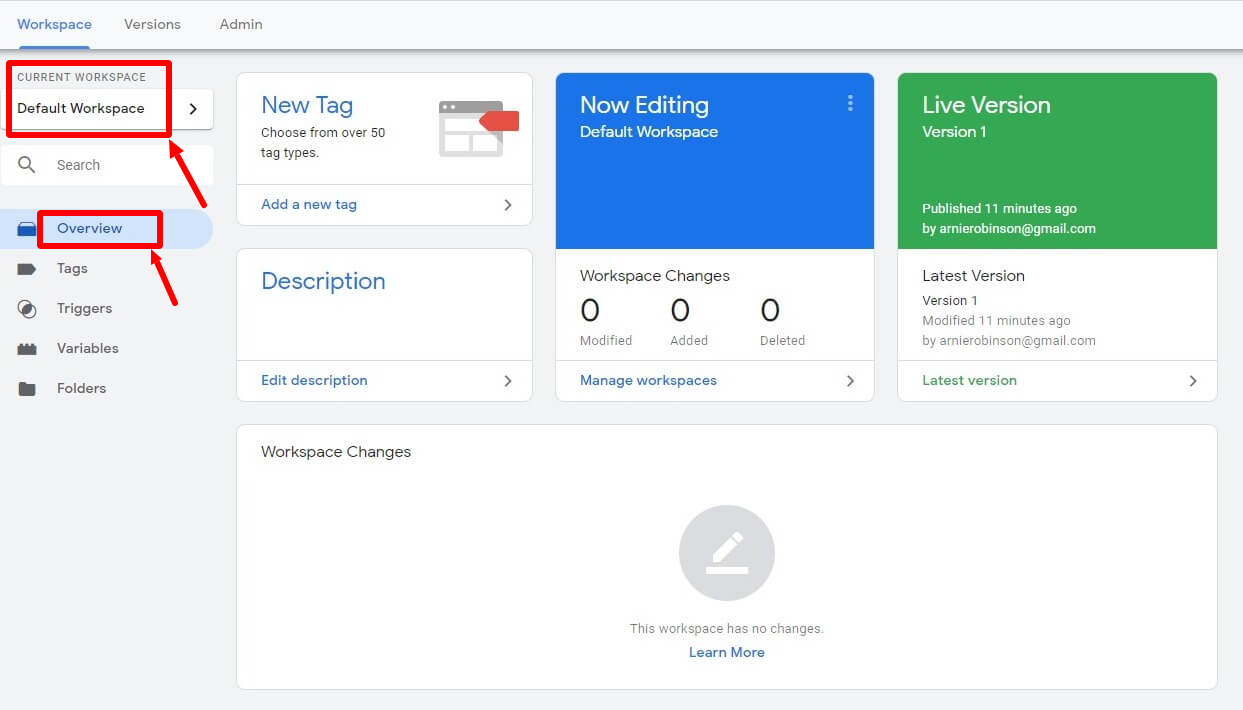
6. Testing Your GTM Installation
Once the GTM code is in place, use the Preview mode to verify the installation. Enter your site’s URL, connect, and look for the “Connected” status. Installing the Tag Assistant Chrome extension can enhance preview mode, making it easier to troubleshoot and confirm everything is working before going live.
7. Adding Google Analytics to GTM
Inside GTM, create a new tag and choose “Google Analytics: GA4 Configuration.” Paste in your measurement ID, set the trigger to All Pages (so it fires on every page load), and name it something clear like “GA4 Config.” Preview the setup to confirm the tag fires, then publish to make it live for all visitors.
8. Confirming Google Analytics Data Collection
Head to GA4 → Admin → DebugView to confirm your tracking code is firing and events (like page views) are being recorded. Keep in mind that data may take a few minutes to appear for new properties. Once confirmed, you can check the Real-Time Report to see live visitor activity.
9. Understanding Standard Reports in Google Analytics
Google Analytics offers a default set of standard reports covering acquisition, engagement, monetization, and retention. The Acquisition report is especially useful for understanding where your traffic comes from. You can view sources grouped into channels, such as “Organic Search” or “Direct,” and dive deeper into performance metrics.
10. Key Metrics to Watch in Acquisition Reports
In the acquisition reports, pay close attention to:
- Sessions: The number of visits.
- Engaged Sessions: Sessions with meaningful activity.
- Event Count: Total number of actions (like clicks or form submissions).
- Conversion Rate (Key Event Rate): The percentage of sessions ending in a desired action.
- Revenue: If e-commerce tracking is enabled.
Filtering and changing dimensions (e.g., to “Session Source/Medium”) can reveal more detailed traffic insights.
11. Filtering and Comparing Data
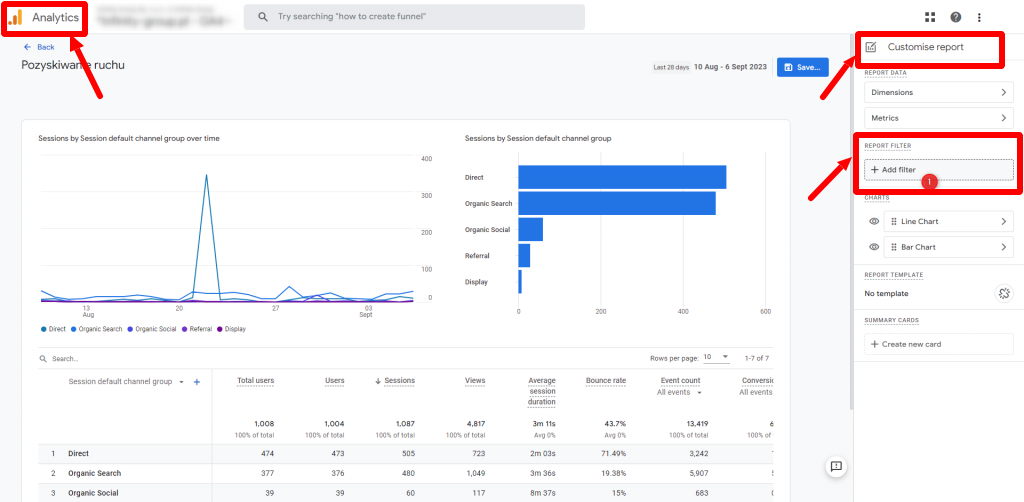
Google Analytics allows filtering by attributes such as country, device, or traffic source. You can also compare multiple segments (e.g., US vs. Canada traffic) to uncover trends. This can help you identify where high-value visitors come from or where you may need to adjust marketing efforts.
12. Landing Pages and Top Content
The Pages and Screens and Landing Page reports reveal which pages attract the most views and where visitors start their journey. This is vital for optimizing high-traffic entry points and ensuring visitors land on pages that encourage engagement or conversions.
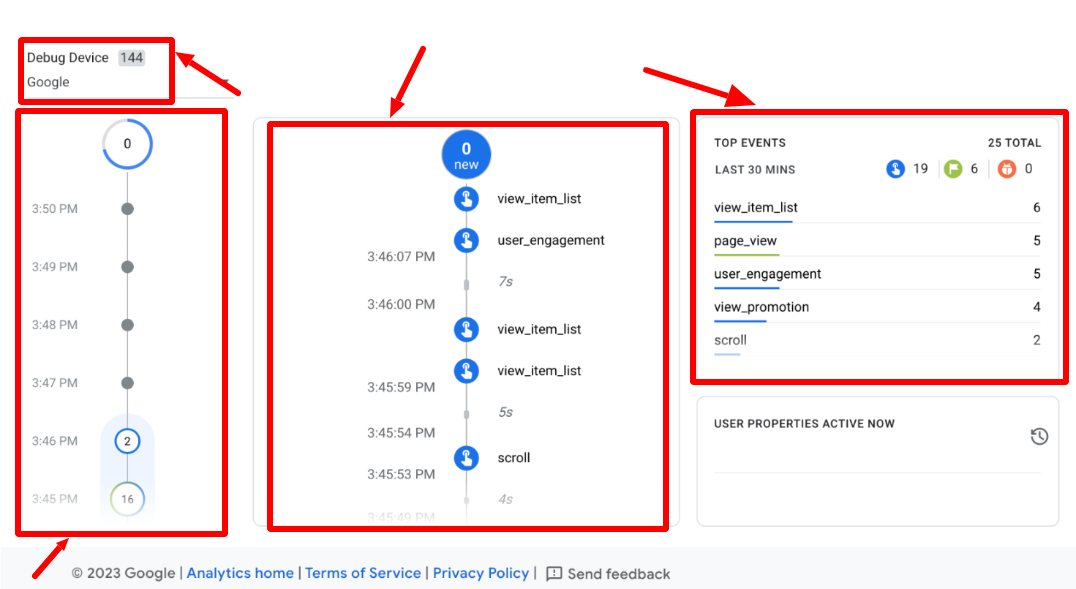
13. Real-Time Overview
The Real-Time Overview report shows visitor activity in the last 30 minutes. You can see active users, their locations, the pages they’re viewing, and what actions they’re taking. This is especially useful for monitoring campaign launches or troubleshooting tracking issues.
14. Using the Explorations Workspace
The Explorations section in Google Analytics allows for more advanced, customizable analysis. Common techniques include:
- Free Form: Create custom tables and visualizations.
- Funnel Exploration: Analyze step-by-step conversion paths.
- Path Exploration: Visualize user navigation flows.
15. Building a Free Form Exploration
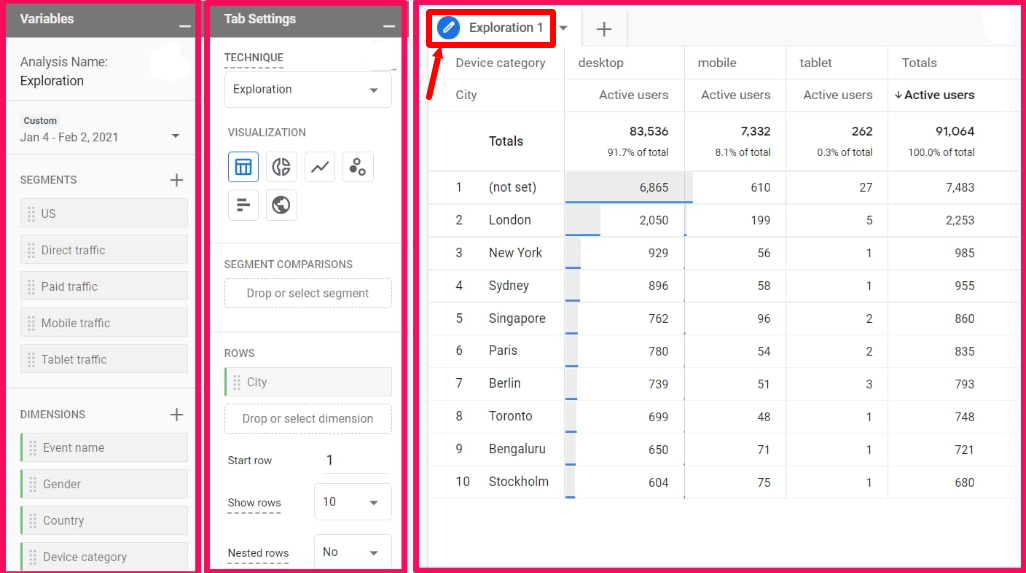
Start with a blank exploration, choose your dimensions (e.g., Country, Device Category), and metrics (e.g., Purchase Revenue). Arrange them into rows and columns to create a table that answers your specific business questions. Visualizations can be switched between tables, heat maps, and charts for easier interpretation.
16. Funnel Exploration for Conversion Analysis
Funnel exploration lets you define steps in a conversion path (e.g., Product View → Add to Cart → Purchase) and see where users drop off. You can break this down by device type to spot usability issues, such as lower conversion rates on mobile compared to desktop.
17. Path Exploration for Navigation Insights
Path exploration reveals how visitors move through your site. Starting from a specific page (like your homepage), you can see where they navigate next. This can help identify loops, dead ends, or popular routes — informing site structure and content strategy improvements.
18. Continuous Learning with Google Analytics
Google Analytics’s interface is packed with features, and mastering them takes time. The key is to experiment with different reports, apply filters, and customize views so you get insights tailored to your goals. Once your tracking is stable, you can focus on interpreting the data to guide smarter business decisions.
Any questions, comments, or reactions about our article, we’re happy to hear that in the comment section below. We always love diving into healthy discussions. If you also feel that you haven’t been using Google Workspace at its best, reach us at (https://cloudsultans.com).
We offer free consultation or system audit to find you the best possible solution.